
Every roof, every dollar, one dashboard.
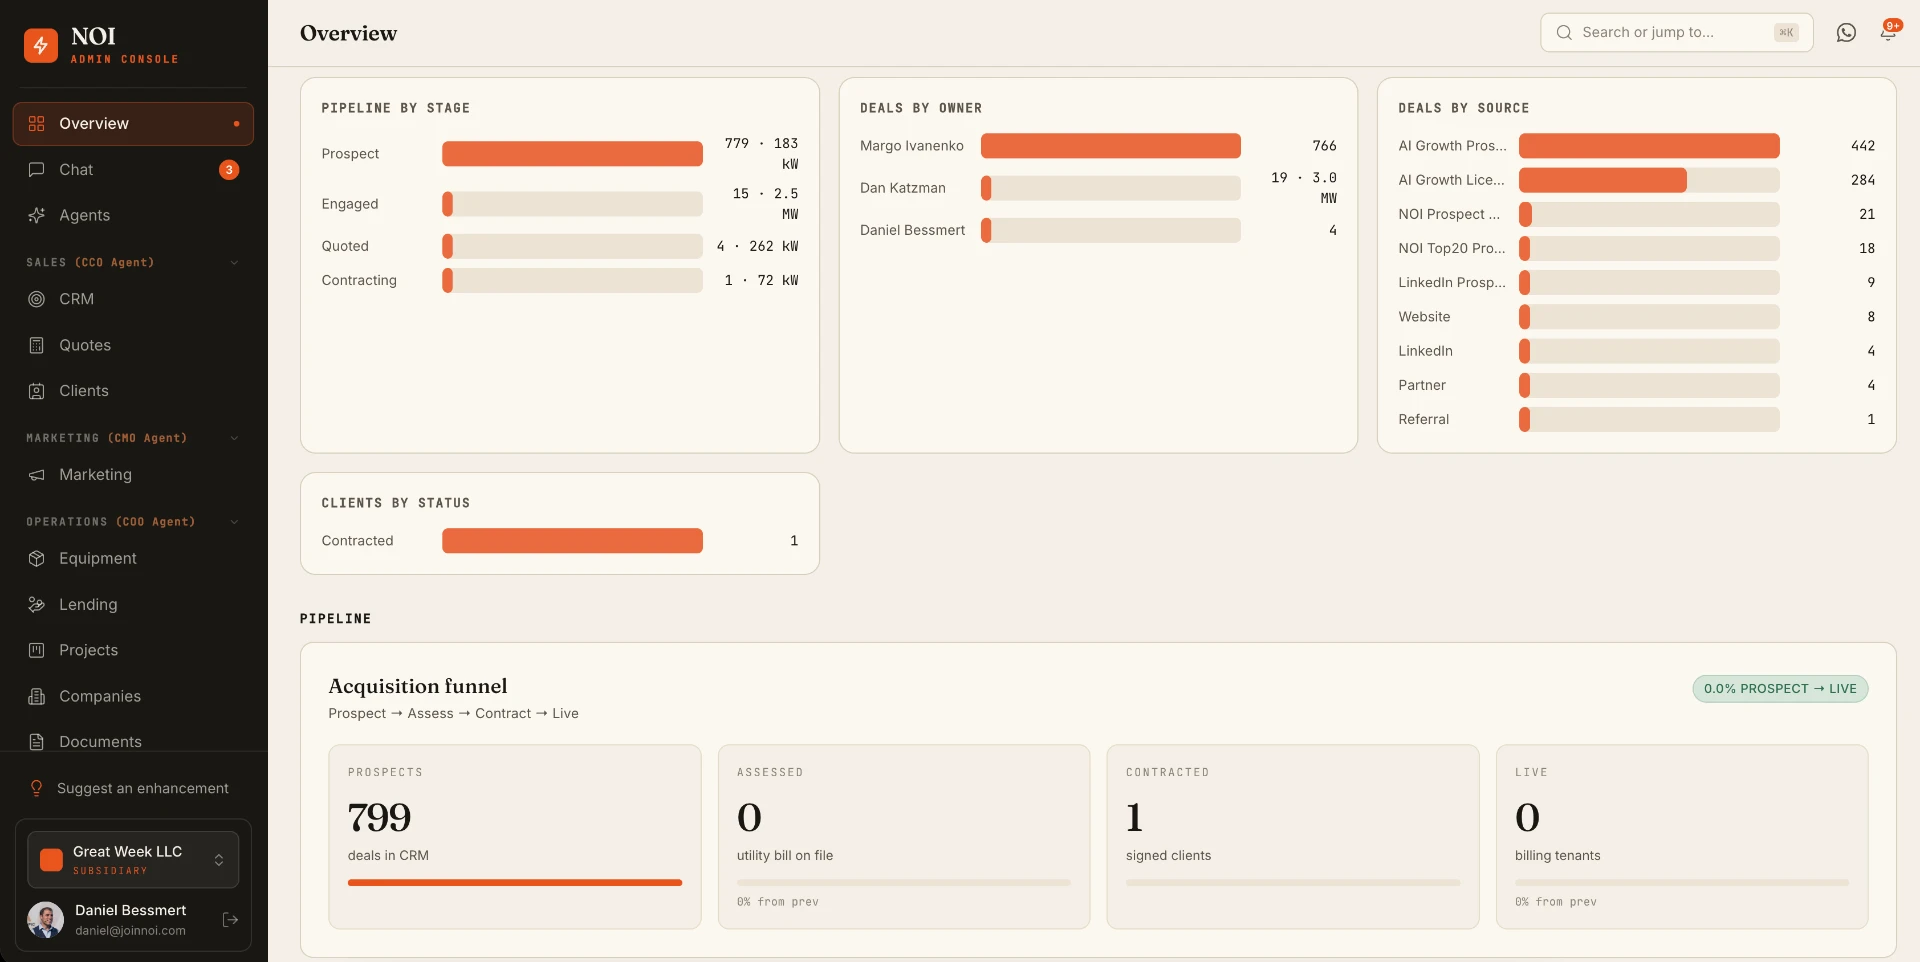
The NOI dashboard shows what your energy assets earn: revenue and NOI uplift by property, production against forecast, resident billing status, and every monthly payout with the statement behind it. No spreadsheets, no chasing your installer for numbers.
Built for asset managers, not engineers.
Monthly solar income per asset, with year-to-date NOI uplift and the trend against forecast.
System output against the modeled curve, so underperformance surfaces before it costs you a quarter.
Enrolment rate, invoices sent, collected and outstanding — plus what residents saved versus the grid.
Every payout with the statement behind it, reconciled to the deposit in your bank account.
Group by owner, fund, region or manager. Compare assets on the same units.
CSV exports for accounting and role-based access for asset managers and PM teams.

Statements your accountant can reconcile.
Each payout arrives with a branded statement: kWh billed, resident collections, fees and the net deposit. Export the same data as CSV per property and per month, and the line in your bank feed always ties back to a document.
How pricing worksQuestions about reporting.
What owners and asset managers can see, export and rely on.
What does the dashboard actually show?+
Solar revenue and NOI uplift by property, system production versus forecast, resident enrolment and billing status, and every monthly payout with the statement behind it.
Do I need to install software?+
No. The dashboard runs in the browser for owners, asset managers and property management teams. Access is role-based, so a regional manager sees their assets and an owner sees the whole portfolio.
Can I export data for accounting?+
Yes. Revenue, payout and billing data export as CSV with per-property and per-month breakdowns that reconcile against the Stripe payouts hitting your account.
How current is the data?+
Production and billing data refresh daily from the meters; payouts appear as soon as they are initiated, with the branded statement attached.
More questions? Read the full FAQ or talk to us.